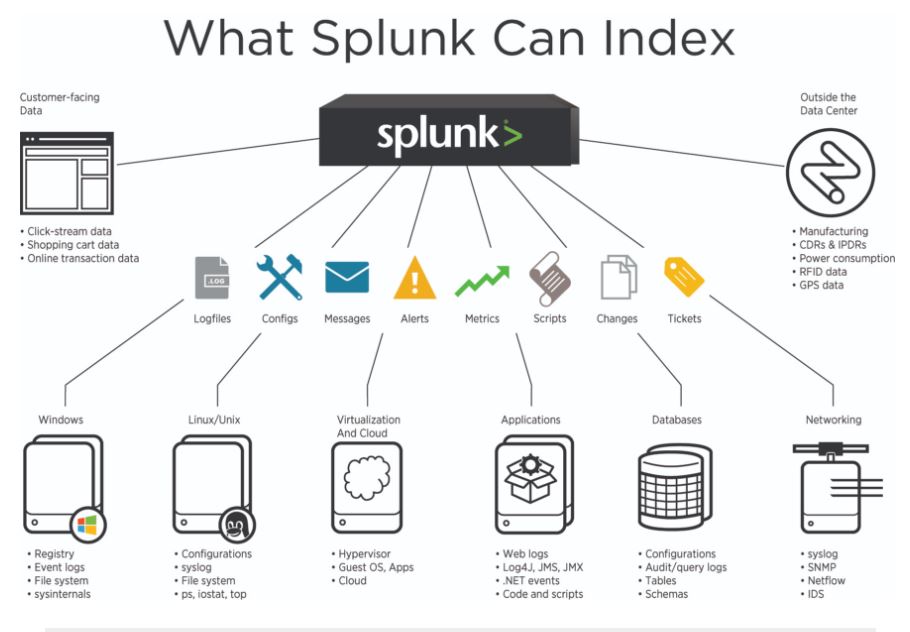
Splunk Enterprise can index any kind of data. In particular, any and all IT streaming, machine, and historical data, such as Windows event logs, web server logs, live application logs, network feeds, metrics, change monitoring, message queues, archive files, and so on..
How do I get data in?
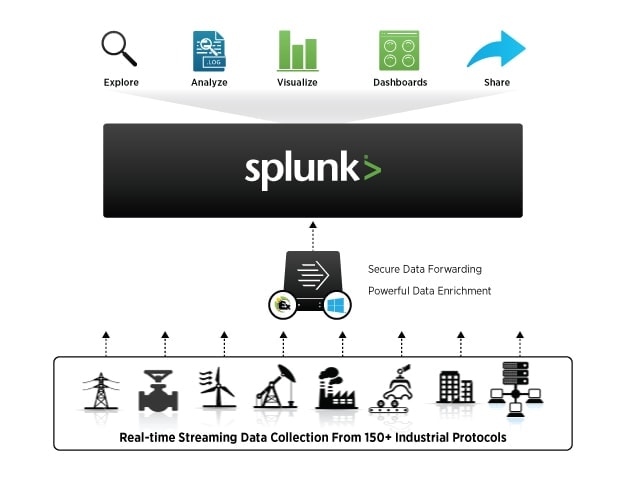
To get data into your Splunk deployment, point it at a data source. Tell it a bit about the source. That source then becomes a data input. Splunk Enterprise indexes the data stream and transforms it into a series of events. You can view and search those events right away. If the results aren’t exactly what you want, you can tweak the indexing process until they are.
Guided Data Onboarding
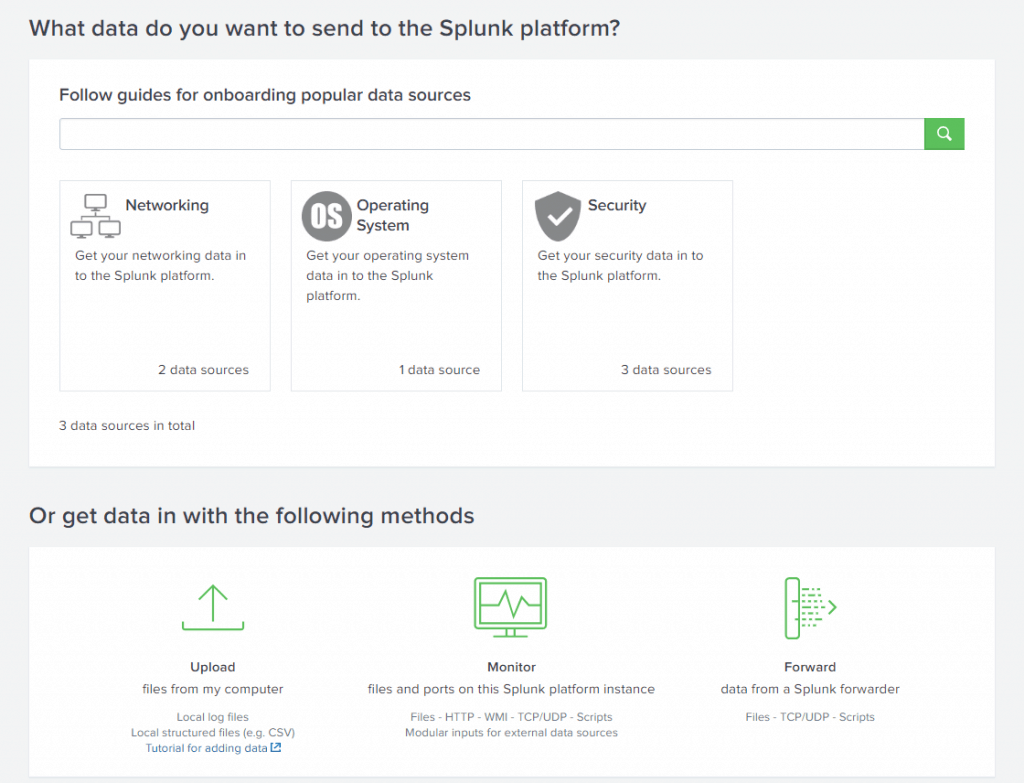
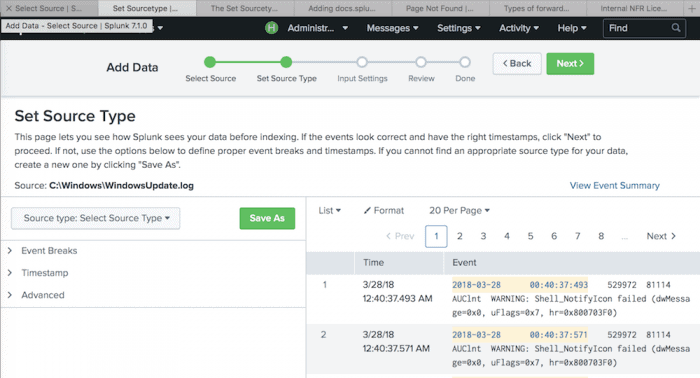
The Guided Data Onboarding (GDO) feature also provides end-to-end guidance for getting select data sources into specific Splunk platform deployments.From your home page in Splunk Web, find the data onboarding guides by clicking Add Data. From there you can select a data source and configuration type. Then view diagrams, high-level steps, and documentation links that help you set up and configure your data source.You can find all the Guided Data Onboarding manuals by clicking the Add data tab on the Splunk Enterprise Documentation site.
Types of data sources
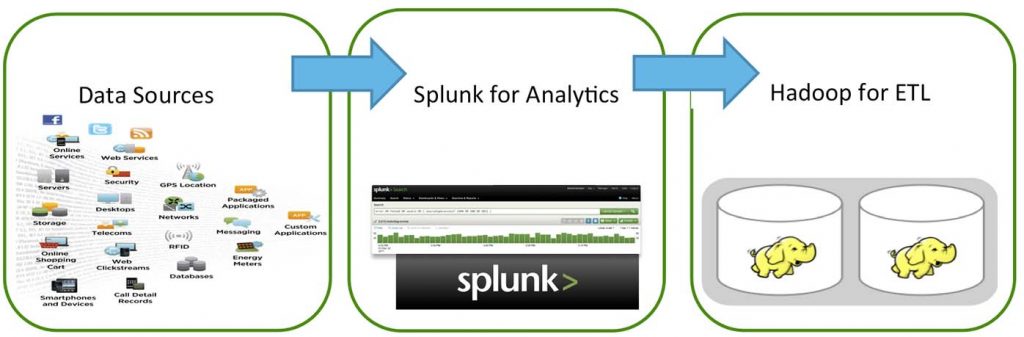
Splunk provides tools to configure many kinds of data inputs, including those that are specific to particular application needs. Splunk also provides the tools to configure any arbitrary data input types. In general, you can categorize Splunk inputs as follows:
Files and directories
Network events
Windows sources
Other sources
Files and directories
Alot of data comes directly from files and directories. You can use the files and directories monitor input processor to get data from files and directories.To monitor files and directories, see Get data from files and directories.
Network events
Splunk Enterprise can index data from any network port, for example, remote data from syslog-ng or any other application that transmits over the TCP protocol. It can also index UDP data, but you should use TCP instead whenever possible for enhanced reliability.Splunk Enterprise can also receive and index SNMP events, alerts fired off by remote devices.To get data from network ports, see Get data from TCP and UDP ports in this manual.To get SNMP data, see Send SNMP events to your Splunk deployment in this manual.
Windows sources
Splunk Cloud and the Windows version of Splunk Enterprise accept a wide range of Windows-specific inputs. Splunk Web lets you configure the following Windows-specific input types:
Windows Event Log data
Windows Registry data
WMI data
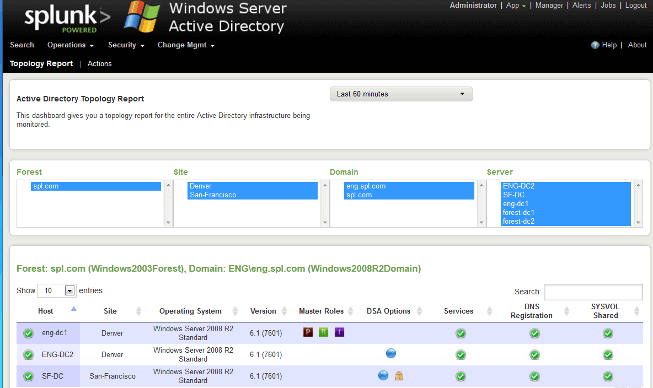
Active Directory data
Performance monitoring data
To index and search Windows data on a non-Windows instance of Splunk Enterprise, you must first use a Windows instance to gather the data. See Considerations for deciding how to monitor remote Windows data.
For a more detailed introduction to using Windows data in Splunk Enterprise, see Monitoring Windows data in this manual.
Other data sources
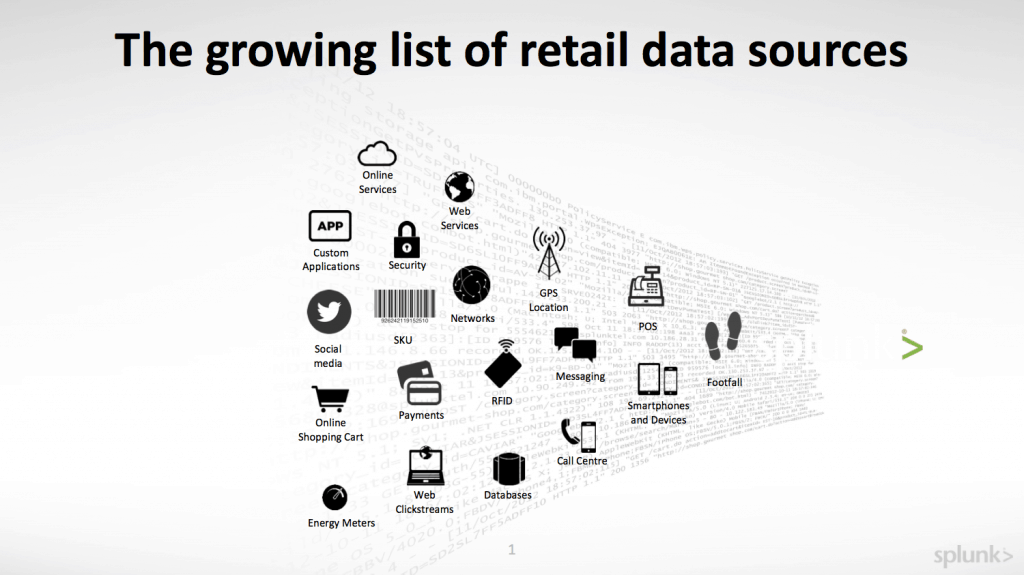
Splunk software also supports other kinds of data sources. For example:
Metrics Get metrics data from your technology infrastructure, security systems, and business applications.
First-in, first-out (FIFO) queues
Scripted inputs Get data from APIs and other remote data interfaces and message queues.
Modular inputs Define a custom input capability to extend the Splunk Enterprise framework.
The HTTP Event Collector endpoint Use the HTTP Event Collector to get data directly from a source with the HTTP or HTTPS protocols.