

Source: Computerworld
Top 5 US States by Salary
Average salaries for IT professionals are on the rise, while non-IT professionals’ salaries are lower
Washington DC $104,265
Virginia $103,395
Maryland
$99,678
Hawaii
$98,004
California
$96,066
New York
$95,219
Computerworld’s 2017 IT Salary Survey
Key findings from survey of 2,782 IT professionals, 55% technical staffers and 45% IT managers — asking them about their compensation, workloads, long-term career prospects and much more.

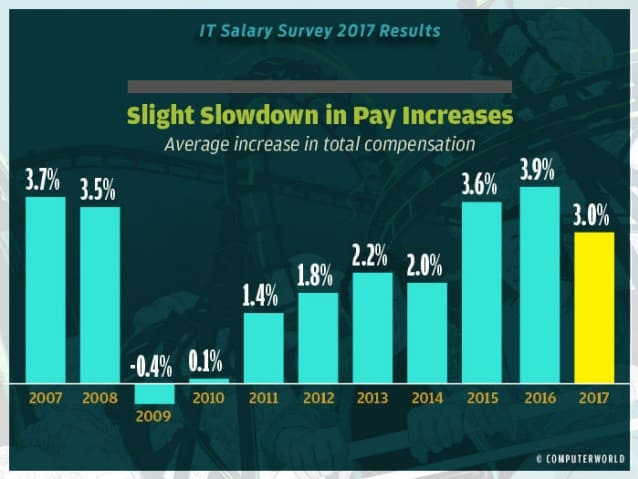
Salary gains stay strong
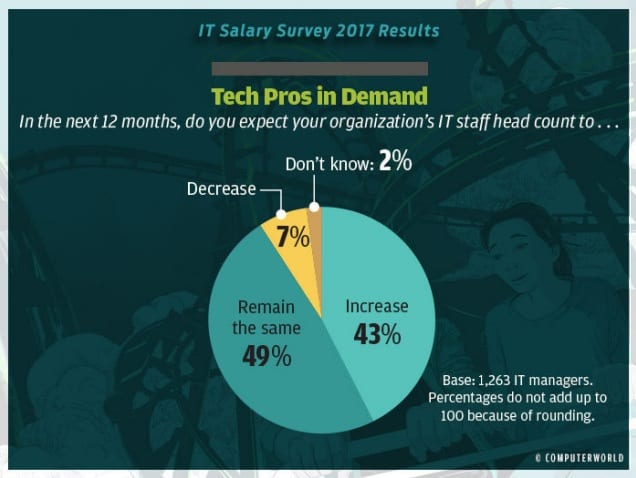
A propitious job market
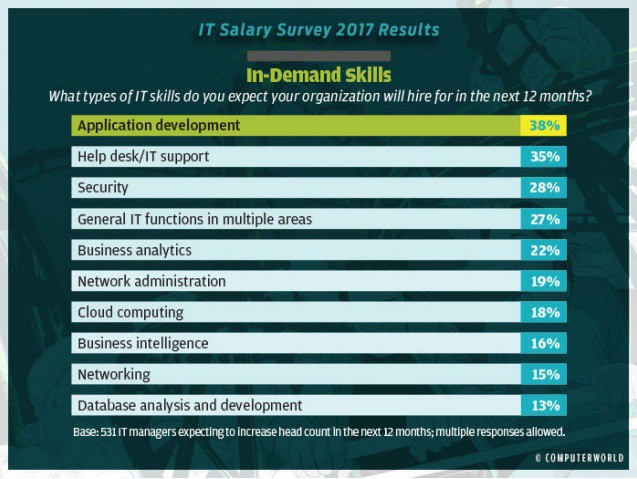
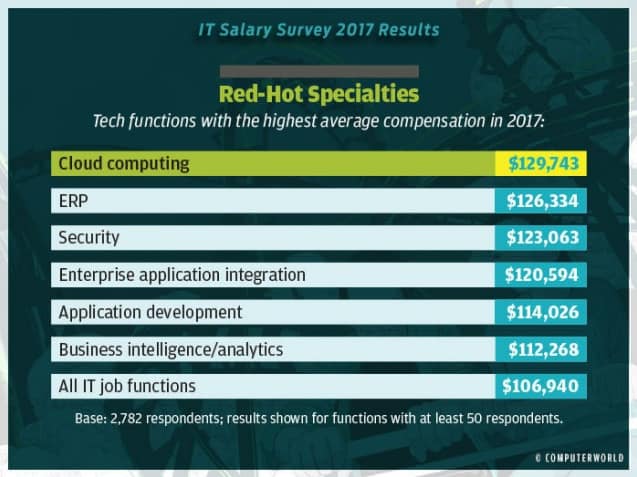
Who’s hot?
The right path

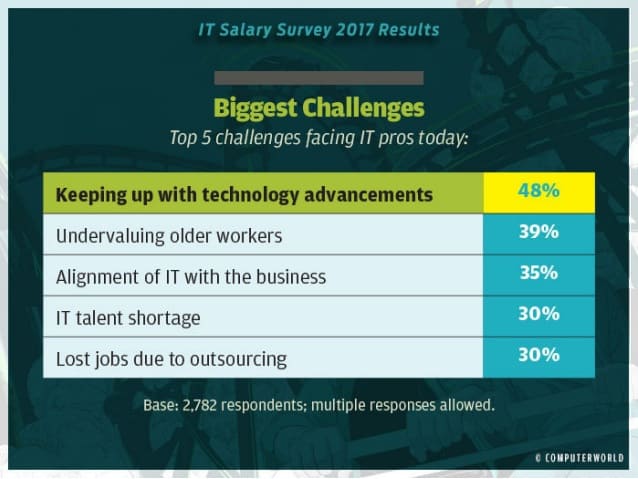
Concerns and challenges
Source: Computerworld
IT Salary Survey 2017: Hottest jobs, cities and industries for IT pay
 Credit: Thinkstock
Hottest IT Job Tittles 2018
| JOB TITLE | CHANGE IN AVERAGE TOTAL COMPENSATION 2016-2017 |
|---|---|
| Help desk/technical support specialist | 5.1% |
| Software engineer | 4.5% |
| Systems administrator | 4.5% |
| Business analyst | 3.9% |
| Systems architect | 3.8% |
| Chief information officer | 3.7% |
| Network engineer | 3.3% |
| Vice president of IT | 3.2% |
| Programmer/analyst | 3.1% |
| Network administrator | 3.1% |
Hottest metro regions for IT pay 2017
| METRO REGION | CHANGE IN AVERAGE TOTAL COMPENSATION 2016-2017 |
|---|---|
| Washington, D.C. | 5.0% |
| San Francisco | 4.8% |
| Los Angeles | 4.5% |
| Boston | 4.5% |
| Raleigh-Durham / Winston-Salem / Charlotte, N.C. | 4.4% |
| Denver | 3.9% |
| Minneapolis / St. Paul | 3.7% |
| Phoenix | 3.4% |
| Chicago | 3.2% |
| Detroit | 3.1% |
Source: Computerworld
Hottest industries for IT pay 2017
| INDUSTRY | CHANGE IN AVERAGE TOTAL COMPENSATION 2016-2017 |
|---|---|
| Banking | 4.2% |
| Entertainment / marketing / advertising | 3.8% |
| Telecommunications | 3.7% |
| Defense / aerospace | 3.5% |
| Legal / insurance / real estate | 3.5% |
| Health / medical services | 3.5% |
| Transportation / logistics | 3.2% |
| Education | 3.2% |
| Manufacturing (noncomputer-related) | 3.0% |
| Finance / accounting | 3.0% |
| Business services / consulting (noncomputer-related) | 3.0% |
A sampling of IT pay by industry
| INDUSTRY | AVERAGE TOTAL COMPENSATION IN 2017 | |
|---|---|---|
| COMPUTER SERVICES / CONSULTING | ||
| Director of IT | $139,764* | |
| Network engineer/architect | $123,509* | |
| Systems architect | $117,671* | |
| Software engineer | $108,874* | |
| Systems administrator | $73,530* | |
| Help desk / technical support specialist | $58,222* | |
| EDUCATION | ||
| CIO / vice president of IT | $147,347* | |
| Director of IT | $95,295 | |
| IT manager | $84,526* | |
| Systems administrator | $72,534* | |
| Network administrator | $61,621* | |
| Help desk / technical support specialist | $47,208* | |
| GOVERNMENT | ||
| CIO / vice president of IT | $120,178** | |
| Director of IT | $103,655 | |
| IT manager | $92,169* | |
| Systems administrator | $79,362* | |
| Network administrator | $68,766** | |
| Help desk / technical support specialist | $54,152* | |
| HEALTHCARE | ||
| CIO / vice president of IT | $188,220* | |
| Director of IT | $116,099 | |
| IT manager | $93,354* | |
| Systems administrator | $82,009* | |
| Help desk / technical support specialist | $51,425* | |
| Technician | $50,085* | |
| LEGAL and INSURANCE | ||
| CIO / vice president of IT | $207,194* | |
| Information security manager | $130,633** | |
| Director of IT | $122,518* | |
| IT manager | $113,294** | |
| Application developer | $92,210** | |
| Systems administrator | $80,292** | |
| MANUFACTURING | ||
| CIO / vice president of IT | $218,455* | |
| Director of IT | $137,303* | |
| IT manager | $98,292 | |
| Network administrator | $75,871* | |
| Systems administrator | $74,009* | |
| Help desk / technical support specialist | $45,584** | |
