Cyber-crime is rising constantly as attackers are coming up with new tools and attacks techniques. To defend the network and protect companies against cyber-attacks, security professionals need security tools such as IDS, IPS, SIEMS. For my network defense tool assignment, I have decided to research about Splunk, one of the most popular Security Information and Event Management (SIEM) in the cybersecurity industry. According to a report published on the site, www.itcentralstation.com, Splunk is the best SIEM tool in 2019. It was conceived by founders Rob Das and Erik Swan between 2002 and 2004 to collect data from different sources, detect security events and to perform real time monitoring. There are several types and licensing models of Splunk available to suit the needs of its customer base. The most popular products are Splunk Enterprise, Splunk Cloud, and Splunk Light. My work will be based on the installation of the free version of Splunk light, its configuration, and its use case to detect a DoS attack, NMAP scanning attack and failed login attempts.
Installation Process
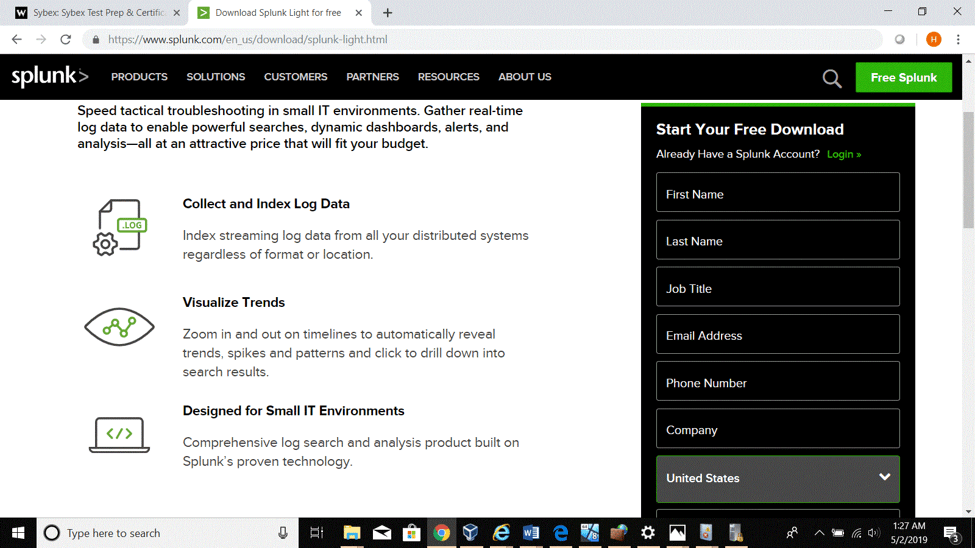
A 1-Go to Splunk , and register for a free trial ( 30 days) to download Splunk light.
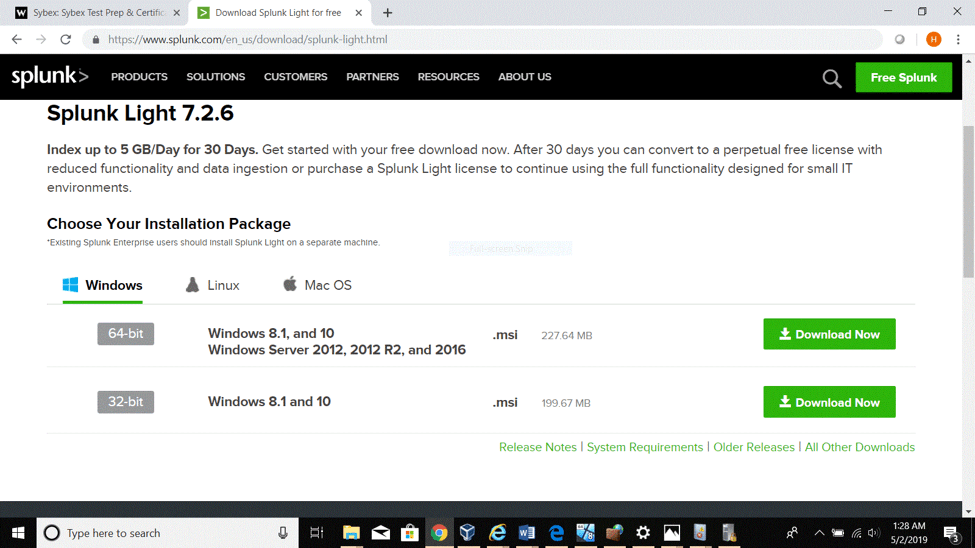
2- After creating a Splunk account, choose the appropriate O.S version for the computer and click on the download link as shown in the figure below:
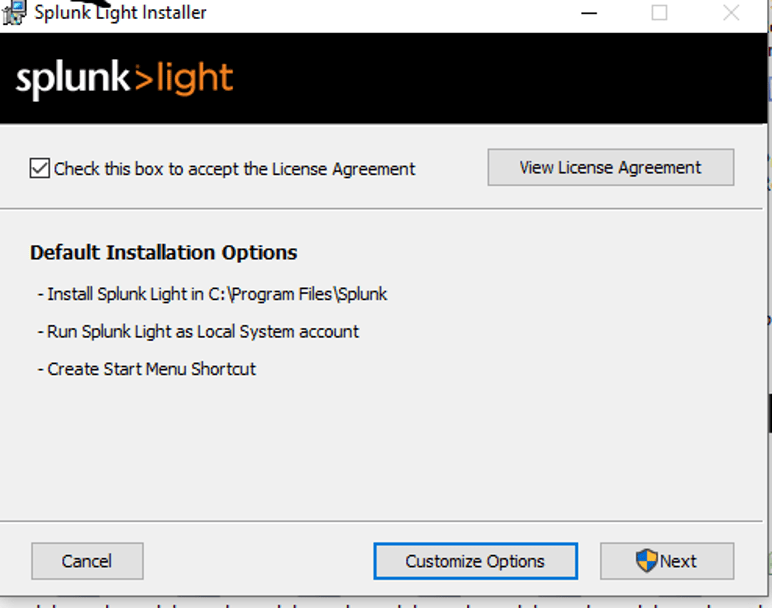
3- Open the download folder and click on the Splunk light installer as administrator.
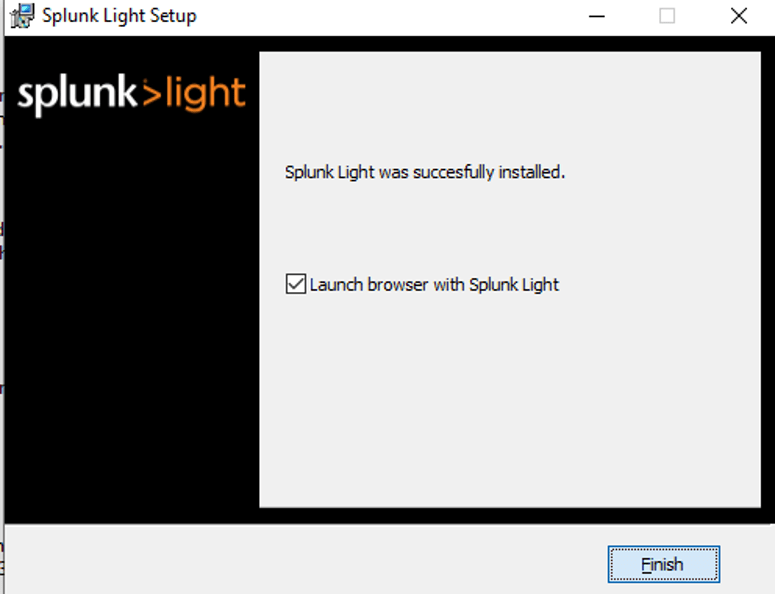
4- Accept the license agreement, proceed with the default installation, and click “finish” when done.
Basic Configuration of Splunk light
Type “Splunklight” in the search bar and click on the icon to start the software.
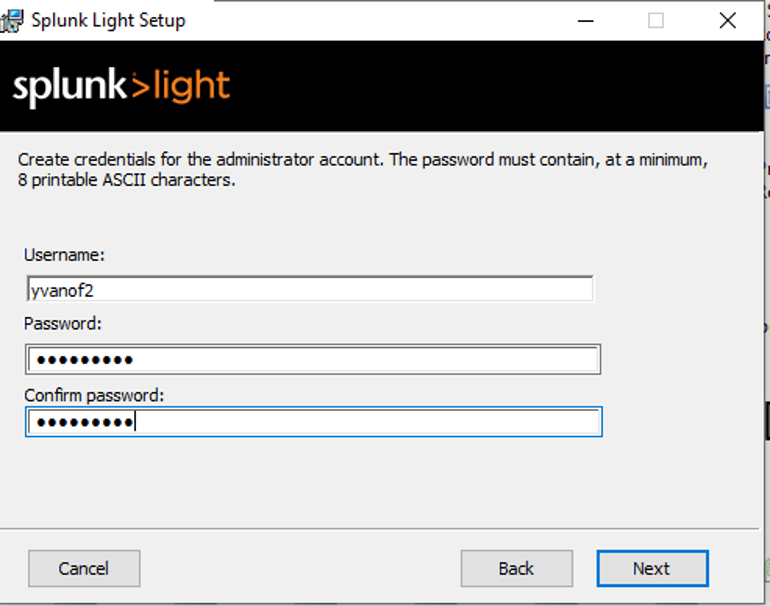
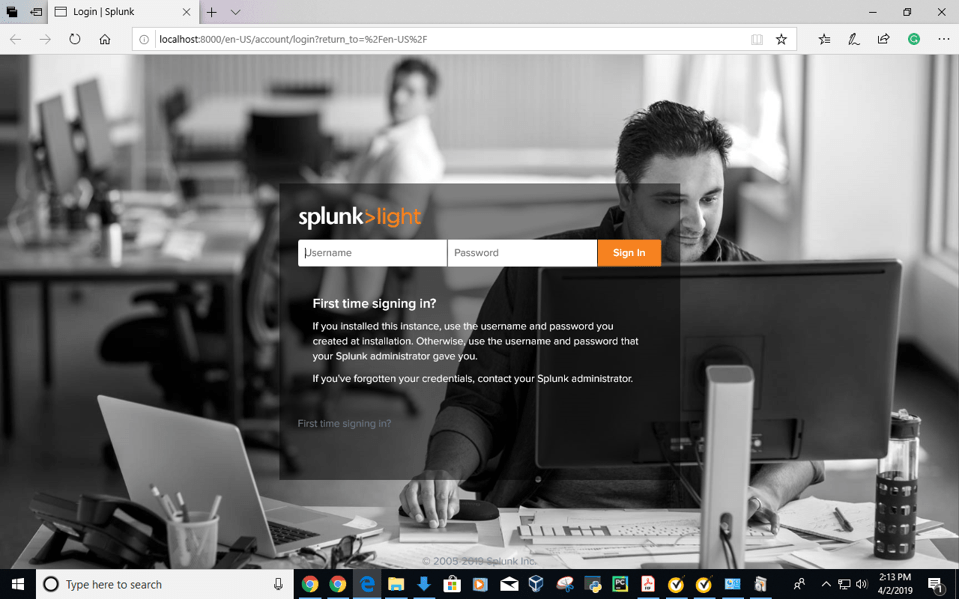
When presented with the user interface, use the administrator credentials created during the installation process.
.
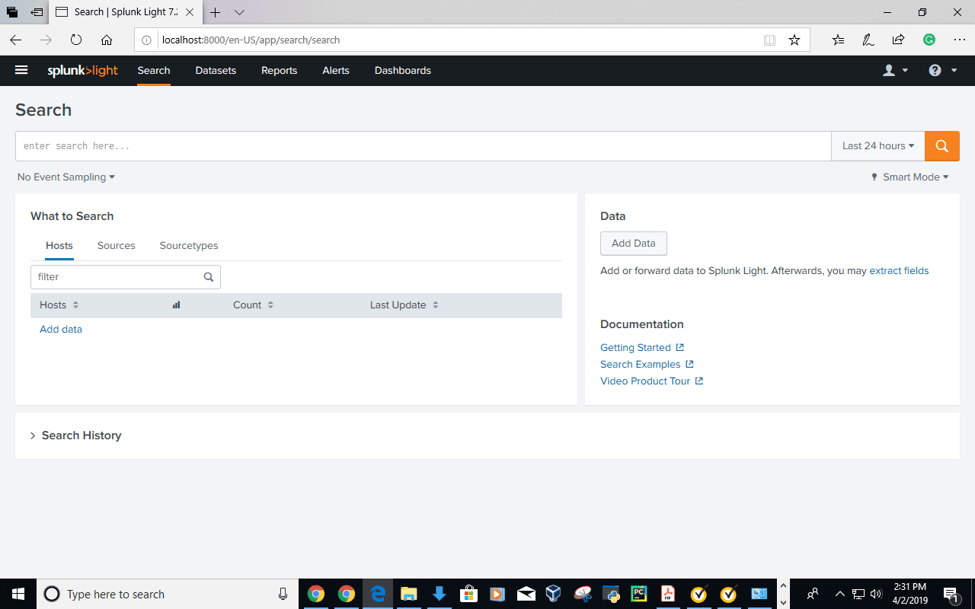
After a successful login, it is recommended to take a quick user tour to get familiar with Splunklight features such as the console which consists of the Search, the Datasets, the Reports, the Alerts, and the Dashboards tabs.
Search:
It allows users to search through data collected on the platform in different ways. It can be time based, source based, and source type based.
Datasets:
Use the Datasets listing page to view and manage your existing datasets. Click a dataset name to view its contents. Click Pivot to design a visualization-rich report based on the dataset. Click Explore in Search to extend a dataset in Search and save it as a new report, alert, or dashboard panel.
Reports:
Reports are based on single searches and can include visualizations, statistics and/or events
Alerts:
Alerts set a condition that triggers an
action, such as sending an email that contains the results of the triggering
search to a list of people.
Dashboards:
Dashboards include searches, visualizations,
and input controls that capture and present available data.
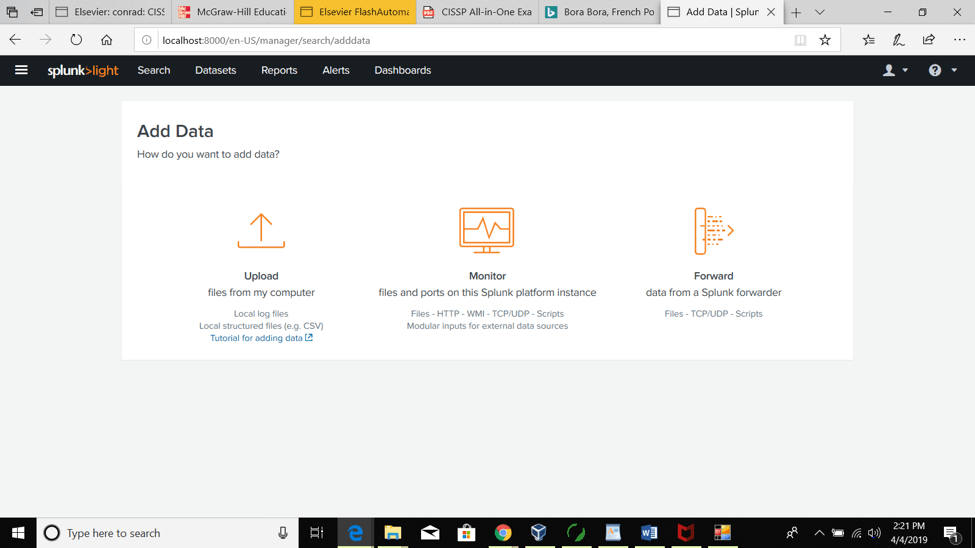
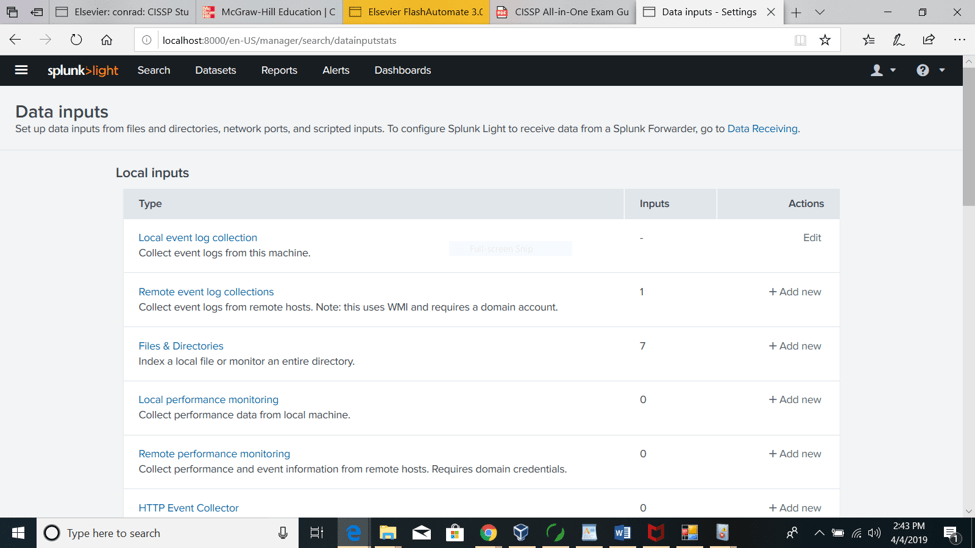
It is important to properly set the source of the data we want to collect for analysis or monitoring on the platform. As shown in the figure below, there are three options such as uploading files from the host computer, monitoring directly from the Splunk instance, and from remote forwarder instances.
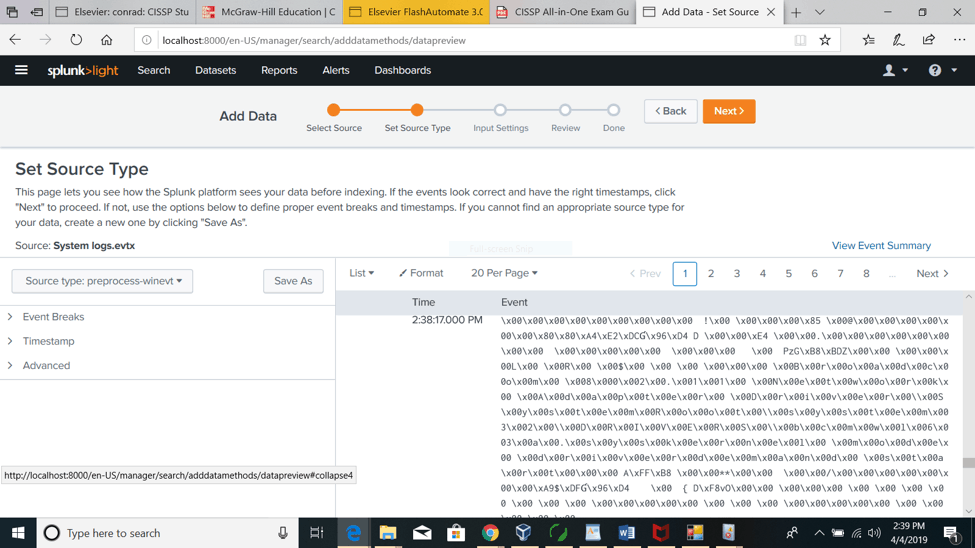
5-The screenshots below show how I used Splunk light to collect my Windows 10 security event logs for further analysis by clicking on “local event log collection” link. Once the data is loaded and indexed onto the platform I can search through it by time range, source type and look for more details on each event. The visualization feature for a customized view. I have saved a search and created an alert that will send me emails notification as administrator if similar events occur in the future. I can also perform a real time monitoring for the same event if I want to.
Using Splunk light to detect security events
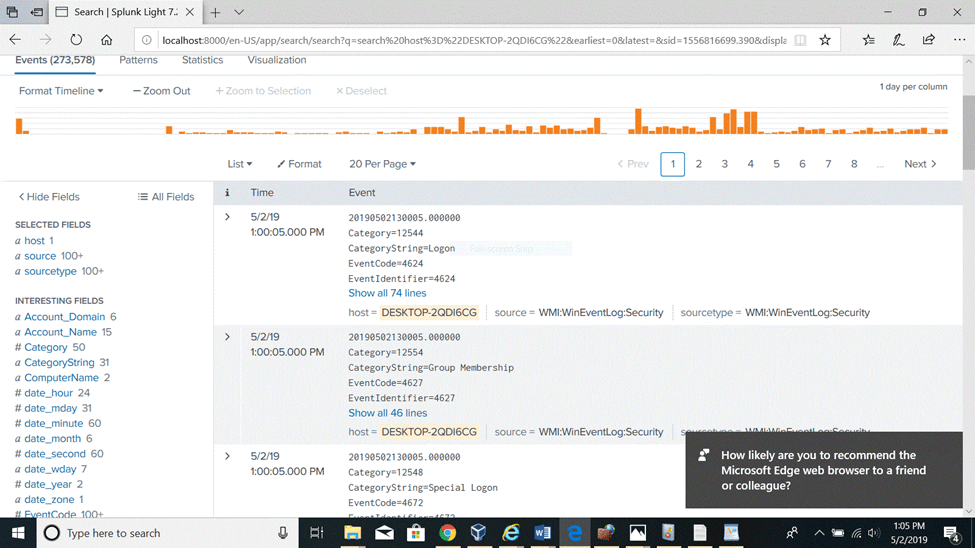
1-Successful login on my windows 10 machine.
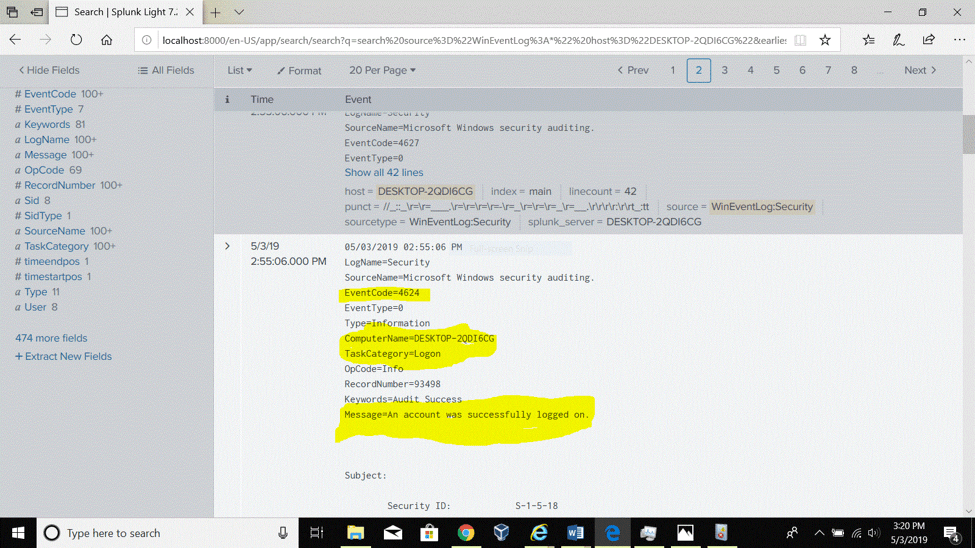
With the Search function I was able to detect the logon event that occurred when I logged in as administrator on my local windows 10 machine.
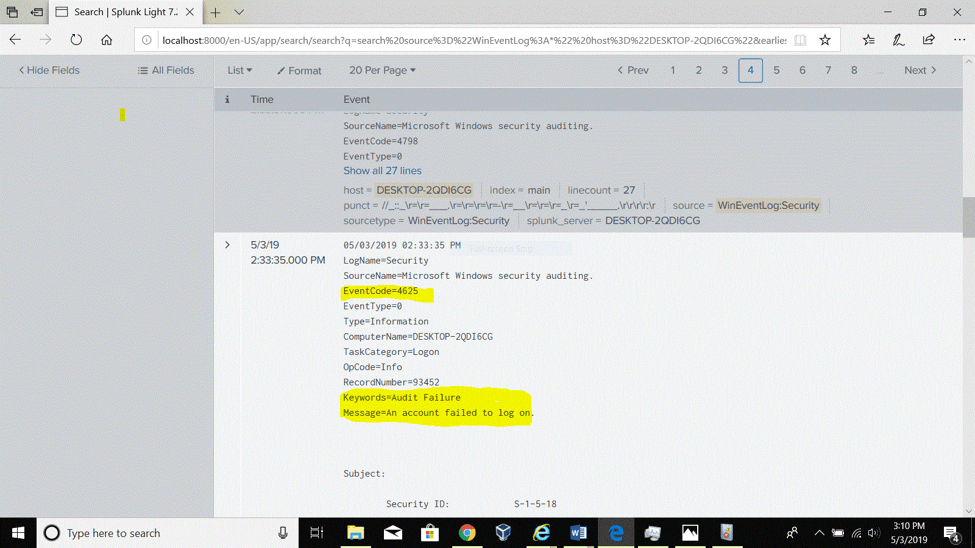
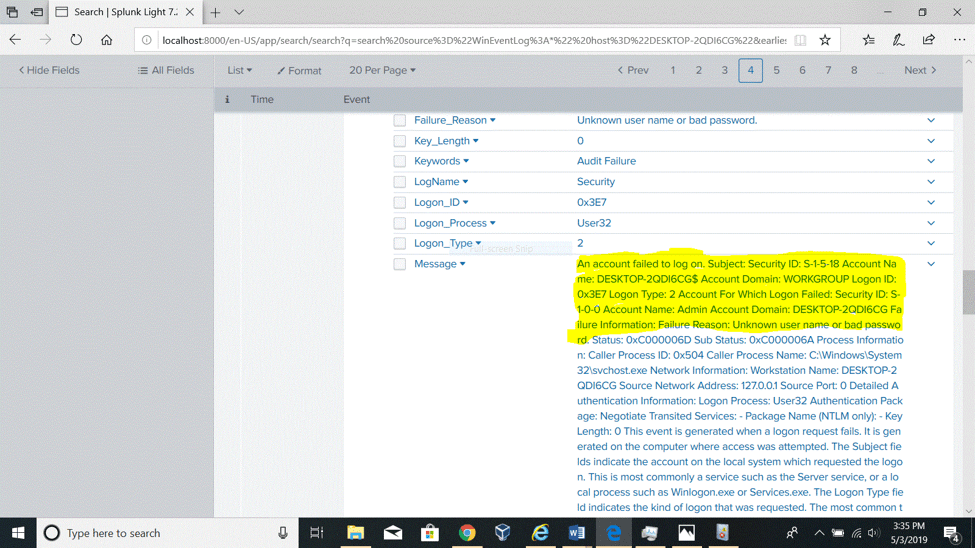
2- Failed logon attempt on the Windows 10 machine
Like in the example above, I searched through the collected logs files a failed logon attempt that is displayed in detail in the two figures below. Based on the details such as the time of the event, its id, the reason of the failure, I can initiate an investigation following the incident response process.
.
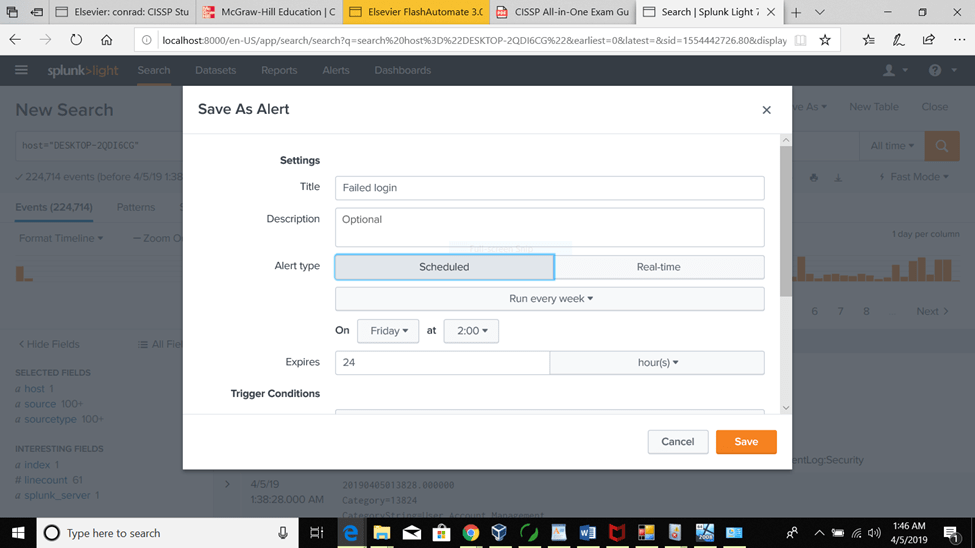
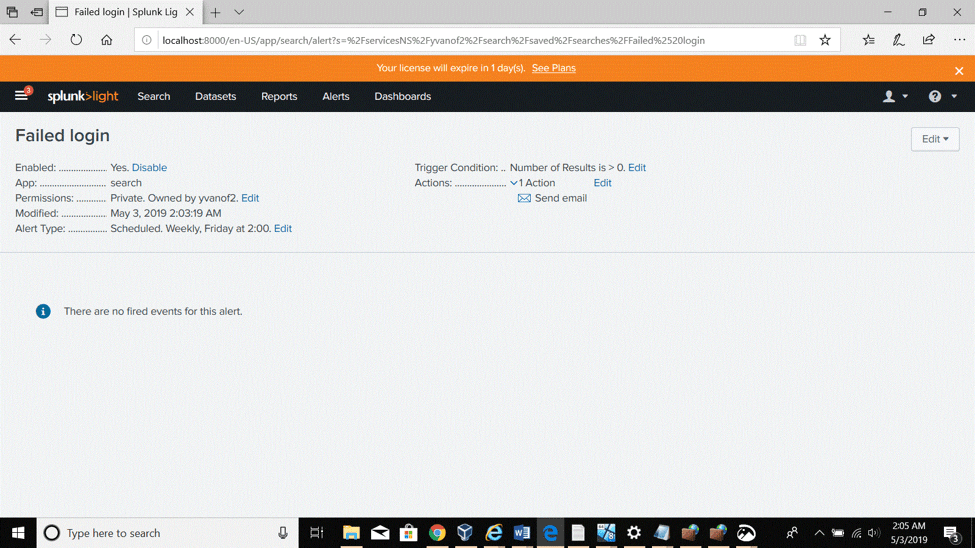
3-Saving the failed logon attempt as an alert.
Not only I was able to detect the failed logon attempt but had I the possibility to save it as an alert that will notify me whenever similar events occur in the future (scheduled alert). I may also set it for real time monitoring.
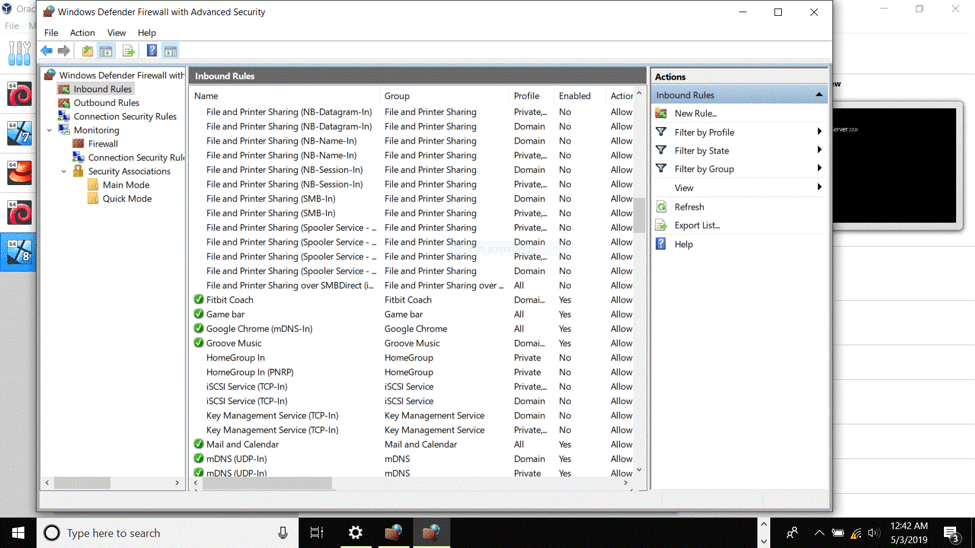
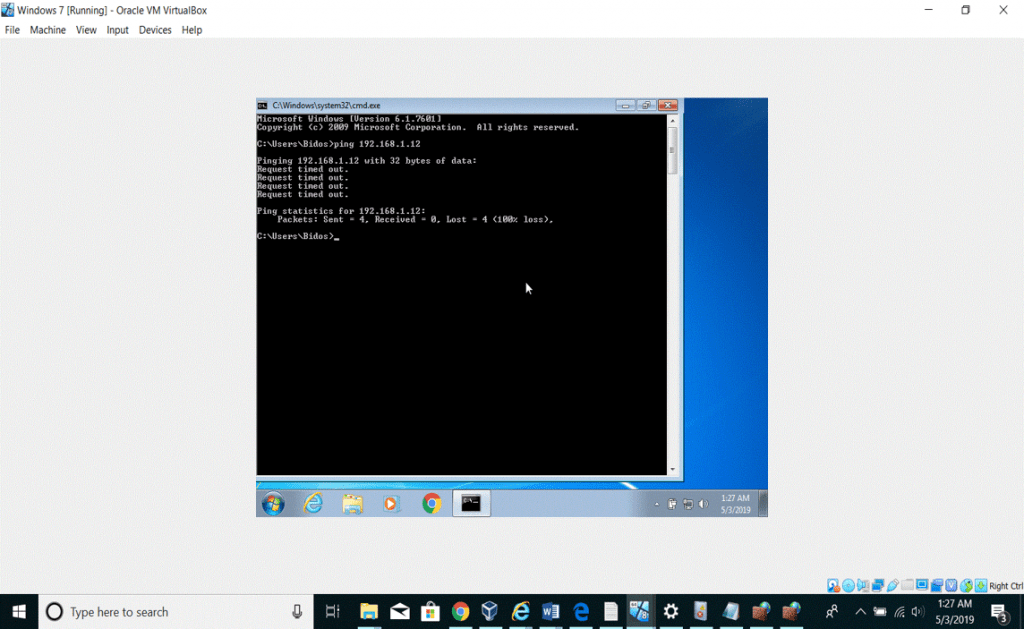
4- Firewall log analysis to detect dropped ICMP packets after a ping attempt from another host on the network.
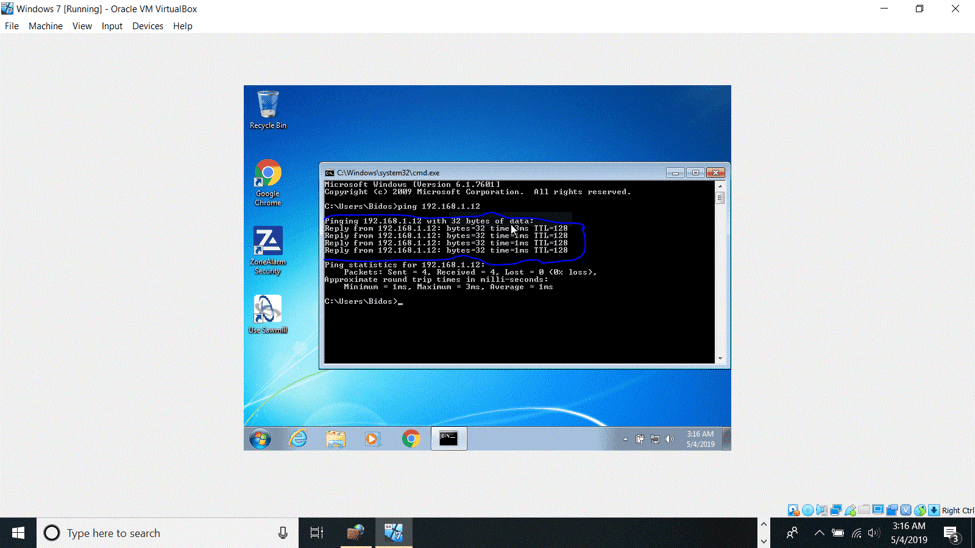
Prior to the ping attempt from the windows 7 machine, I ensured that the Windows firewall is enabled and the ICMP communication is not allowed by default. At the command line interface on a Windows 7 machine I tried to ping the Windows 10 host which is address is 192.168.1.12.
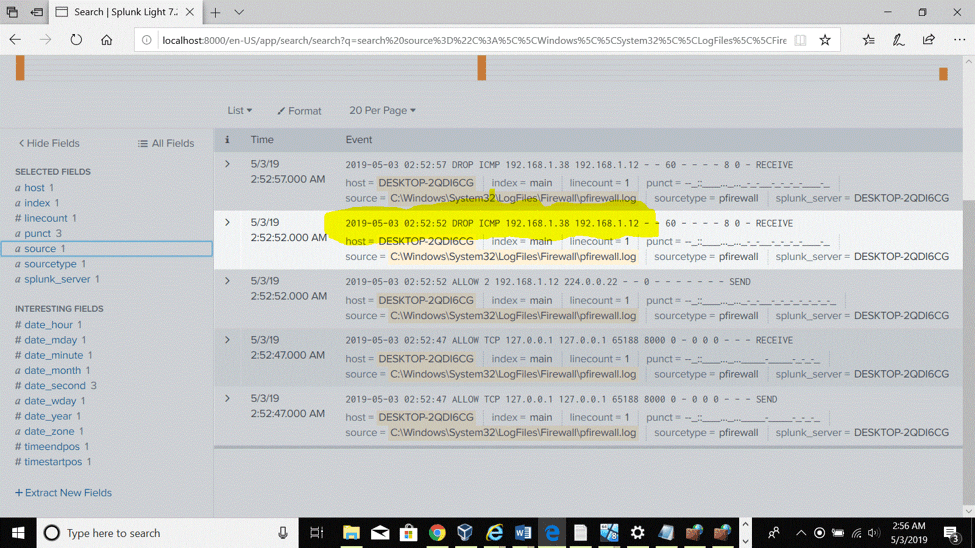
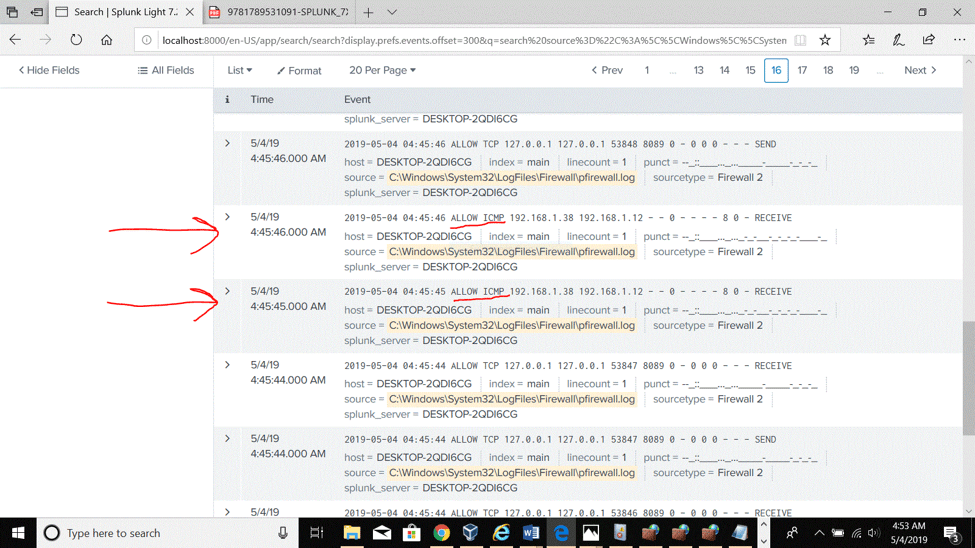
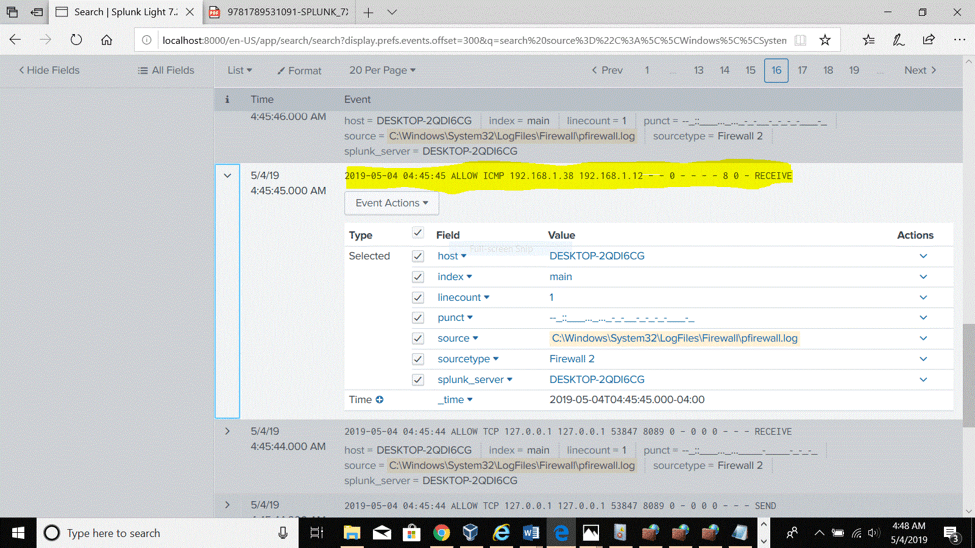
As highlighted in the third figure below on the Splunk platform, all the ICMP packets were dropped. Significant information such as the source ip address, the time of the event also appear in the detected event.
Detecting successful ICMP packets with Splunk light
Allowing ICMP packets through the firewall can be dangerous to the network. According to the book Guide to Network Defense and Countermeasures, “a DoS attack called an ICMP flood occurs when multiple packets are sent to a single host on a network. The result of this flood is that the server becomes so busy responding to the ICMP requests that it cannot process other traffic.” Prior to simulate the Dos attack on my Windows 10 machine, I kept the firewall enabled but allowed the ICMP traffic through it. The screenshots above illustrate each step of the simulation where I initiated multiple pings connections from the Windows 7 machine toward the windows 10. Those successive packets kept the Windows 10 machine’s CPU busy and unavailable to process legitime requests.
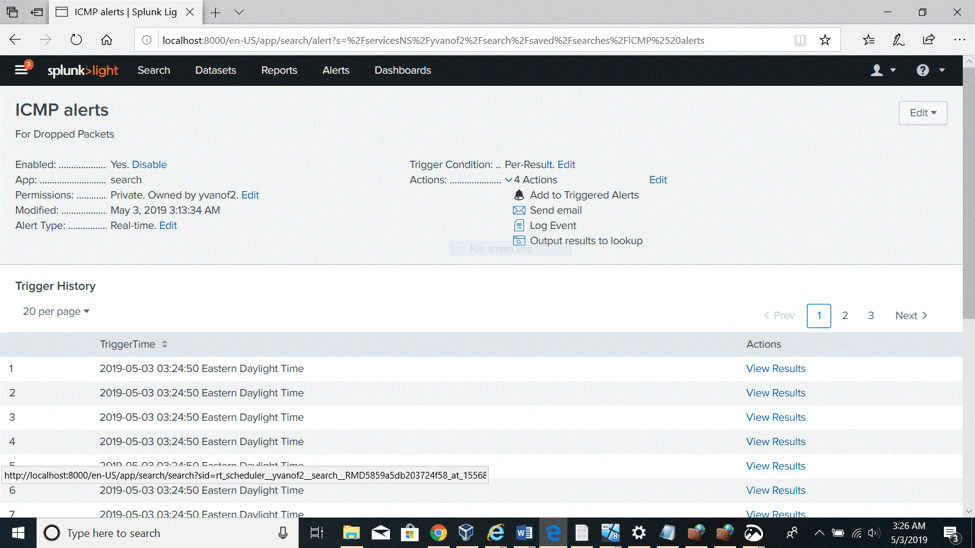
Saving Unsuccessful ping (ICMP packets detection) as a critical alert.
Because the use of ICMP protocol is risky for the network, any ICMP packet should be taken seriously and analyzed properly. Therefore, the detection above also is saved as a critical and a scheduled alert with email notification to the administrator.
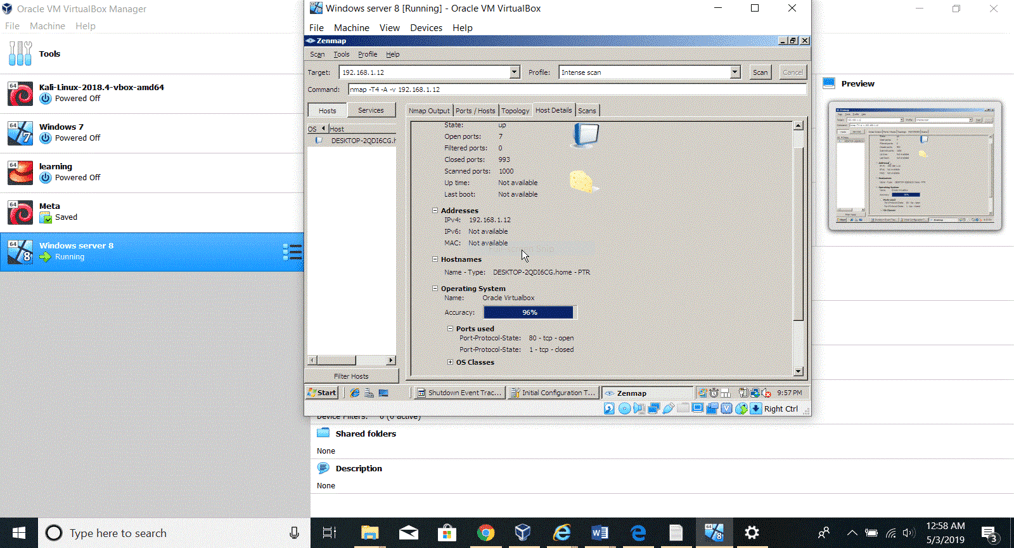
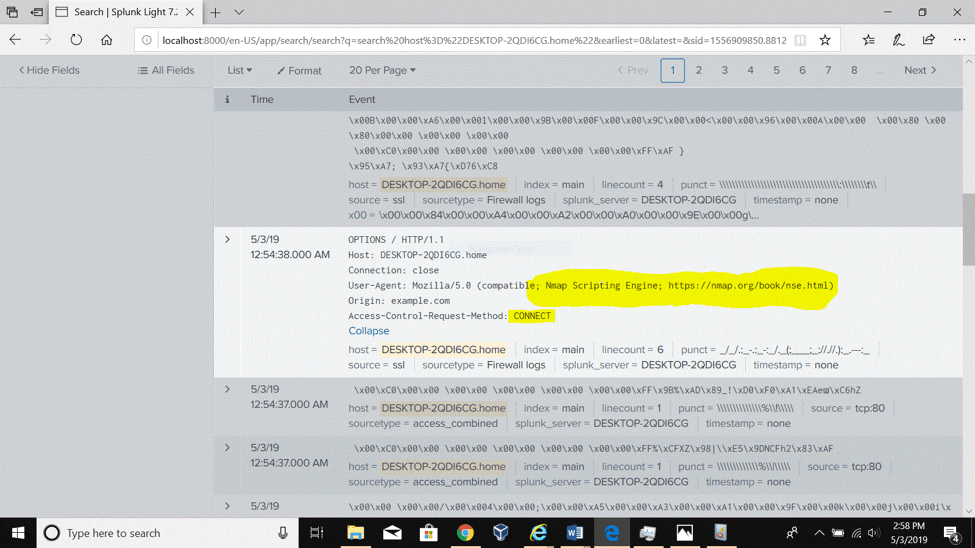
-The last security event is NMAP scanning detection.
The screenshots below illustrate the scenario where I scanned the windows 10 machine for open ports using NMAP which I had previously installed on a Windows 8 server machine.
Summary and Conclusions
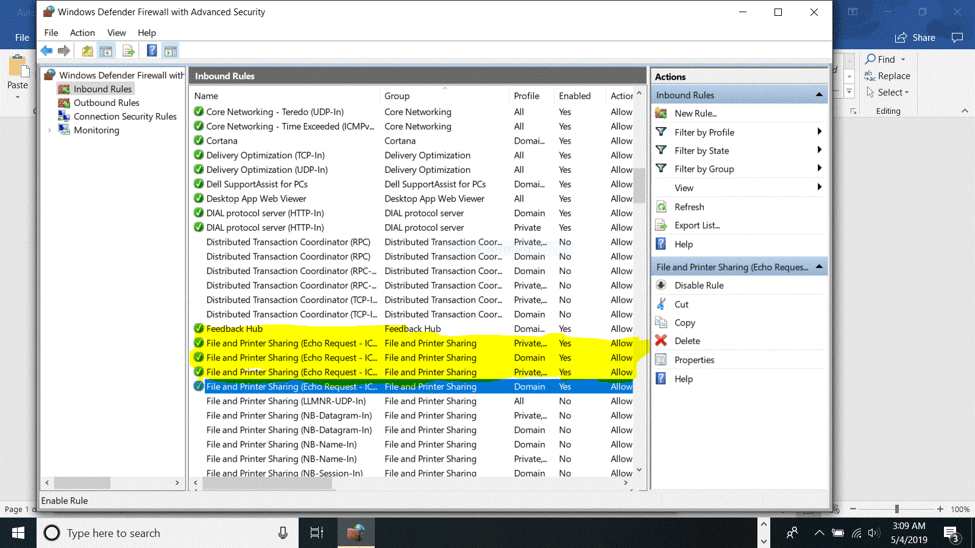
Through the installation and the use of Splunk light, I have gained more technical skills about the SIEM tool. I have learned how to collect firewall and event logs files and analyze security events upon detection. The simulation sections have enabled me to practice what I have learned about common network attacks such as login attacks, Denial of service attacks with ICMP packets and reconnaissance attack with NMAP scanning. In fact, the implementation of Splunk has been useful because it detected all those three security events that occurred on my Windows 10 machine. Therefore, security professionals should always configure Splunk for notification of critical alerts. In case of the detection of a failed logon attempt by Splunk, an administrator should follow the incident response process by investigation the event and find out the reason behind it and implement a countermeasure such as implementing account lockout policies. The best implementation against the DoS attack with ICMP packets is to disable the echo request rules in the firewall and the use of antivirus.
By Bidossessi Tobossou ( ASM Instructor)
Sources: James Miller, Implementing Splunk 7 – Third Edition, Randy Weaver, Guide to Network Defense and Countermeasures, Chap 3, Page 85, ITcentralstation,Splunk